Job trainers have a lot of things to check off their to-do list.
One is to evaluate the learning of employees who have completed training. This means things like assessments and tests, seeing if people can pass tests, have necessary knowledge, and (most importantly) have acquired necessarily skills/can perform necessary tasks.
The second is to determine if the training is having a positive effect on the relevant performance metrics for the company and, if possible, to determine an ROI for the training (this is how you’re going to really prove your worth and really prove your training is effective). In terms of Kirkpatrick’s training evaluations, we’re talking about the elusive but equally important Level 4 here.
But a lot of trainers go to school and learn a lot about instructional design theory while learning next to nothing about performance metrics (this includes me-guilty). As a result, it’s not always clear how to start showing if training has had a positive effect on those performance metrics.
To help solve this problem, we thought we’d give you an introduction to some of the theory behind the development of meaningful workplace performance metrics, and in particular to what are known as “balanced performance metrics.”
This will be one of a series of articles we’ll write on how training is related to performance metrics and KPIs not just for the training department but for the company as a whole, so keep your eyes on future articles for more on this topic.
What you’ll learn here is based off a handy little guide called Designing Metrics: Crafting Balanced Measures for Managing Performance by Dr. Bob Frost. We found this book to be really helpful, pleasantly brief, and to-the-point. We recommend you buy a copy if this article sparks your interest, and we note that Dr. Frost has written a few other books that look interesting as well. In particular, Measuring Performance: Using the New Metrics to Deploy Strategy and Improve Performance looks like it might be good and a logical next step to this book.
- Learning Management Systems
- Online Workforce Training Courses
- Incident Management Software
- Mobile Training Apps
What Is a Balanced Performance Metric?
Frost begins his book by breaking performance metrics into two very broad categories:
- The old way to do it
- The new way to do it (Frost wrote this book in 2007, and he repeatedly notes that this “new way” originated in the 1990s or so)
The primary difference, according to Frost, are explained below.
The Old-School Way to Design Performance Metrics
Older performance metrics:
- Are focused primarily/solely on financial aspects
- Present just one perspective
- Are “lagging indicators” that take a snapshot in time and give information only about the past
- Aren’t “leading indictors” and don’t give actionable information
- Don’t present enough context to know the all-important “why?”
- Are poorly presented in tables that are hard to read/make sense of
- Tend to lead to unintended consequences in which workers ignore important things at work simply to improve measured metrics
The New-School Way to Design Performance Metrics
On the other hand, newer methods create performance metrics that:
- Are focused on multiple aspects of the company
- Present a variety of perspectives
- Aren’t just “lagging indicators” but provide “leading indicators” as well
- Give actionable information
- Do give enough context to know or get closer to the all-important “why?”
- Show trends
- Are presented visually in tables and graphs (not numerically in tables or in text)
- Balance forces that have a natural tendency to contradict and/or be in conflict with one another at work
Frost explains that these newer metrics are “balanced,” meaning that they look at many parts of a company’s performance instead of just focusing on financials. This allows companies to evaluate their performance from more perspectives or “angles,” to gain more insight into what they’re doing, and to better anticipate what they should be doing next.
We’ll learn more about these various balanced performance metrics in the next section.
Six Balanced Performance Measurement Frameworks
According to Frost, measuring performance begins by selecting a measurement framework.
Your measurement framework(s) will help you identify your company’s critical success factors (CSFs), and your CSFs will help you identify what you measure (your key performance indicators, or KPIs).
Frost then presents six different balanced measurement frameworks. They are:
- Balanced scorecard
- Strategy maps
- Stakeholder framework
- Program logic model
- Enterprise performance framework
- Cascading framework
Let’s look at each in more detail, leaning on Frost’s explanations in his book.
Balanced Scorecard
The Balanced Scorecard is a popular framework for performance metrics. According to Frost, it’s the most commonly used at Fortune 500 companies, and Mobil Oil’s use of it is especially well known (it was critical for helping a once-floundering Mobil turn things around, according to Mobil execs, before they merged with Exxon).
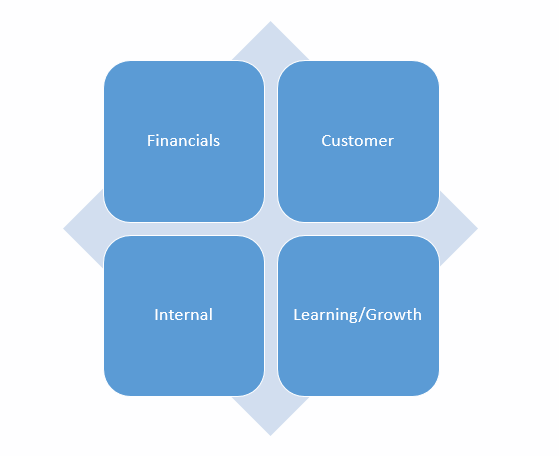
Companies that use a balanced scorecard measurement framework should ultimately create performance measures in four different categories:
- Financial
- Customers
- Internal
- Learning/Growth
Let’s look at each in more detail.
Financial performance measures:
Nuts and bolts financial measures.
Internal performance measures:
How are your internal processes progressing?
This includes things like quantity, quality, speed, cost, and so on.
Customer performance measures:
What do your customers think of you?
Customer satisfaction measurements, things like customer service wait time, etc.
Learning/growth performance measures:
These items ultimately address whether or not you can sustain growth and/or retain your current market position (or improve it).
Can include “nuts and bolts” things like training time, training completed, and training costs, but also things like major changes implemented and new strategic dimensions.
Want to know more about the balanced scorecard? Check out The Balanced Scorecard: Measures that Drive Performance by Robert S. Kaplan and David P. Norton, available at the Harvard Book Review.
Strategy Maps
Strategy maps are really just a “repackaging” of the balanced scorecard to make it clear how the balanced scorecard and the performance measurements lead to the business achieving its business strategy. The strategy map was developed by Kaplan and Norton, big players in performance measurement, in their book The Strategy-Focused Organization: How Balanced Scorecard Companies Thrive in the New Business Environment.
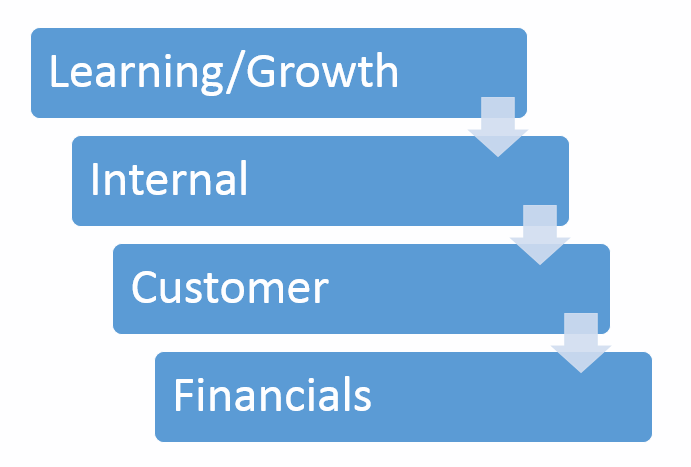
A strategy map looks at the same four aspects that the balanced scorecard does, but with each leading to the next.This makes it easy to see the company’s strategy as laid out in the measurement framework.
From “bottom” to “top,” these are:
- Learning/Growth
- Internal
- Customer perspective
- Financial
Let’s look at how each leads to the next.
- Learning and Growth: Focused, strategic changes in the company’s knowledge and skills leads to…
- Internal: New and/or improved processes, which lead to…
- Customer: Better results for customers and increased customer satisfaction, which leads to…
- Financials: Better financial bottom line(s)!
Stakeholder Framework
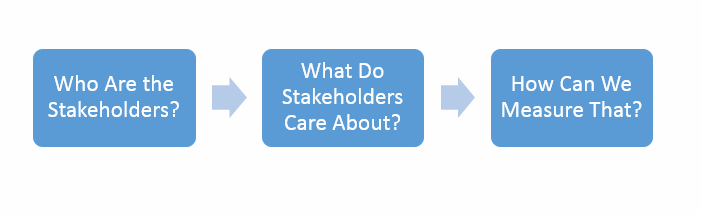
This framework is a three-step process:
- Identify your stakeholders
- Figure out what they care about
- Figure out how to measure what they care about
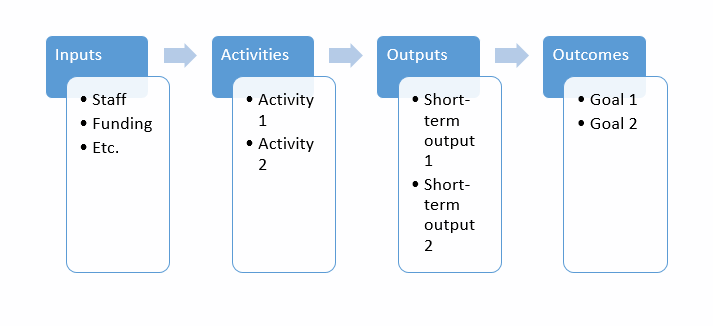
Program Logic Model
This one is more common in government agencies and non-profits and not used much at all in business.
There are different ways to use the program logic model. In one of the most common, you break things down into four categories:
- Inputs
- Activities
- Outputs
- Outcomes
Let’s look at each.
Inputs:
Inputs include resources use to “do” things (human, financial, facilities and technologies).
Activities:
Activities include the things that get done.
Outputs:
Outputs are short-term results of getting those things done.
Outcomes:
Outcomes are the ultimate, long-range goals of the organization or program.
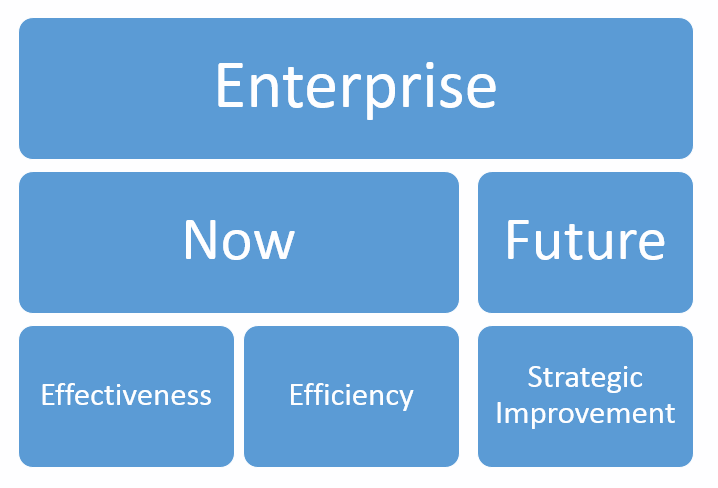
Enterprise Performance Framework
The enterprise performance framework is fundamentally based on the recognition of economic pressures and competition within a market.
It looks at three aspects of a company:
- Effectiveness
- Efficiency
- Strategic Improvement
Let’s look at each a little more.
Effectiveness: How well is the company (or organization) doing in terms of completing its ultimate goal or mission?
Efficiency: How efficiently is the company doing in terms of reaching its ultimate goal or mission? Or few (or many) resources is it using to make its accomplishments?
Strategic Improvement: What is the company doing internally to anticipate/adapt/change/prepare for the future and changing business realities?
As you see, effectiveness and efficiency look at the present (and the past), while strategic improvement looks at the future (and the present).
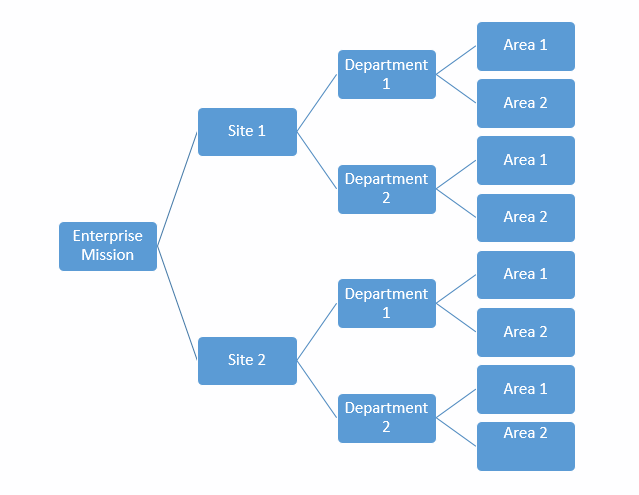
Cascading Framework
The cascading framework starts by identifying the company’s key mission or goals, then analyzes how the business units (and increasingly smaller sub-units) contribute to helping the company achieve that mission.
So it might look something like this:
- Business goal/mission
- Each business unit
- Under each business unit, the sub-unit(s)
- etc.
The idea is that each business unit is evaluated based on how they contribute to the goal or the critical success factors (CSFs) of the unit above.
So, for example, level 2 may include 20 different mills at 20 different sites. Each mill would be evaluated based on how it’s helping the organization as a whole attain its goal(s).
Level 3 (at one of those 20 mills) might include departments such as Production, Quality, HR, etc. Each department would be evaluated based on how it’s helping the mill it’s part of achieve its critical success factors (CSFs).
And level 4 (at one of those 20 mills, in one of those departments, such as Production), might include multiple areas, such as Machine Line 1, Machine Line 2, and so on. Each area would be determined based on how it’s helping its department achieve its critical success factors.
The point is to make sure different business units don’t “go rogue/AWOL” and become so autonomous they’re not really contributing to the overall mission.
Performance Measurement Frameworks, Critical Success Factors (CSFs), and Actual Performance Measurements/Key Performance Indicators (KPIs): The Road Ahead
Now that you know about balanced performance measurement frameworks, let’s see how you can select one, then use that to develop a list of critical success factors (CSFs) and then use those to create your list of performance measurements/key performance indicators (KPIs).
![]()
Selecting a Performance Measurement Framework
So what’s the best measurement framework for your company?
There’s no one answer for that. Frost recommends getting to know them, analyzing which fits your circumstances best, and picking one, then moving forward to create your critical success factors (CSFs) and your actual measures/key performance indicators (KPIs). He stresses the importance of remembering that measurement frameworks true worth is in helping you select CSFs and KPIs.
From Performance Measurement Frameworks to Critical Success Factors (CSFs)
Critical success factors are the things your company must do to have success and be successful in the future.
Once you’ve identified your performance framework, you can use them to begin identifying your CSFs.
For example, if you’re using the balanced scorecard measurement framework, and you’re considering the “Customer” category, CSFs include things like customer satisfaction.
Create a list of all the CSFs for your performance measurement and then move on to the next step.
From Critical Success Factors (CSFs) to Measurements/Key Performance Indicators (KPIs)
Critical success factors are then used to determine what you should measure.
Again, let’s assume we’re using the balanced scorecard measurement framework. As part of the balanced scorecard, we’re identifying the critical success factors (CSFs) for our Customer level. We’ve determined that customer satisfaction is one of those CSFs.
We can then determine ways to measure customer satisfaction–such as “average time on hold or in line” and “percent of cases successfully closed.”
How Many Measurements/KPIs?
Again, there’s no single right answer here.
Frost suggests that you have enough measurements that you acknowledge complexity, but not so many that you get lost, and notes that not all measurements will be important at all times.
In addition, he warns you against the tendency to “rob Peter to pay Paul” when measurement systems are set up. If your company is going to measure something, know that there will be a tendency for people to try to meet that measurement even at the expense of other important things that aren’t measured. Keep them in mind and try to create a balanced measuring system.
Conclusion: Balanced Performance Measurements–A Trainer’s Introduction
We hope that was helpful. Let us know if you have any thoughts by writing in the comments section below. We’d be especially interested to hear what you learned about this in school (if you did) and what measurements your company uses.
Because this issue is so closely related to training evaluation for trainers, you may also be interested in some of the following articles:
- Business Goals, KPIs, and Job Training
- Kirkpatrick’s Four-Level Model for Training Evaluation
- How to Measure the Impact of Training on Business KPIs
- Level 4 Training Evaluations
- Isolating the Effects of Your Training Program
Please feel free to download our FREE GUIDE TO WRITING LEARNING OBJECTIVES, below.
How to Write Learning Objectives
All the basics about writing learning objectives for training materials.
Mr. Dalto, I have recently completed training to engineers and designers on the topic of Geometric Dimensioning and Tolerances (GD&T) at an industrial corporation. The basic understanding of symbols with respective tolerance zone and features were tested prior to and after with great impressive results. Beyond that I presented the basic logic to the application of GD&T to a “blank design” compared to current “copy” practices of that organization. The “copy” is quite common as most corporation build on existing designs. Returning to the “basics” force thinking to what is truly needed for the customer, cost and quality. Speed to market on “copied” practice may speed the drawing to production. However, speed in continual manufacturing requires “time” in design to insure what is “needed” not added by prior designs. This training has been neglected by many, and lost by senior member reduction. Not every aspect of business is in a “program” and understanding “needs to capabilities” is essential to long term quality and costs.